Inspirated


March 8, 2010

Using overlays for source code listings in LaTeX Beamer

Filed under: Blog — krkhan @ 9:33 pm

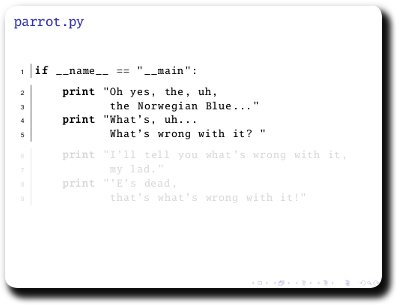
The standard way of including source code listings in Beamer is to use the semiverbatim environment. Needless to say, it does not provide all the syntax highlighting and line-numbering love of the listings package. Combine the two and you have something pretty as well as extremely helpful in delivering presentations which have code:

1
2
3
4
5
6
7
8
9
10
11
12
13
14
15
16
17
18
19
20
21
22
23
24
25
26
27
28
29
30
31
32
33
34
35
36
37
38
39
40
41
42
43
44
45
46
47
\documentclass{beamer}
 
\setbeamercovered{transparent}
 
\usepackage{pxfonts}
\usepackage{listings}
 
\begin{document}
 
\lstset{language=python,
        numbers=left,
        numberstyle=\tiny,
        showstringspaces=false,
        aboveskip=-40pt,
        frame=leftline
        }
 
\begin{frame}[fragile]
\frametitle{\texttt{parrot.py}}
\begin{semiverbatim}
\pause
\begin{lstlisting}
if __name__ == "__main":
 
\end{lstlisting}
 
\pause
\begin{lstlisting}[firstnumber=last]
    print "Oh yes, the, uh,
           the Norwegian Blue..."
    print "What's, uh...
           What's wrong with it? "
 
\end{lstlisting}
 
\pause
\begin{lstlisting}[firstnumber=last]
    print "I'll tell you what's wrong with it,
           my lad."
    print "'E's dead,
           that's what's wrong with it!"
 
\end{lstlisting}
\end{semiverbatim}
\end{frame}
 
\end{document}

Overlayed Listings in Beamer

Tags: , , , ,

March 3, 2010

The Defense

Filed under: Blog — krkhan @ 10:08 pm

Continuing the process of presenting my proposal for the graduation project, I was required to do a presentation. Now, I have never really liked PowerPoint and for more reasons than it being a product of Microsoft (I was never really into OpenOffice.org Impress either).

In fact, I have never liked doing presentations in the first place. My preferred means of communicating an idea is through written material or face-to-face discussions. Anyhow, seeing as I had to do a formal presentation, I turned towards the solution that would provide some additional attraction for me: LaTeX Beamer.

After fiddling around with my .tex for a few hours, I was able to create something which looked [*] far more professional, sexier and informative than anything I had ever created using traditional presentation software:

ittc-defense-presentation.pdf
Presentation Screenshot

To view the presentation you have to open it in “Slide Show” mode of your favorite PDF reader. What totally blew me away was the ease with which I could create lovely bibliographic references, mathematical equations and little fun things like navigational bar on top of every page. Perhaps it’s got to do something with the mindset of a programmer, but I certainly became more productive with Beamer within a couple of hours than I had been throughout my experience with PowerPoint/Impress.

[*] Whether they were professional, sexy or informative is a totally different matter and has very little to do with either LaTeX or Beamer.

Tags: , , ,

January 6, 2010

(GUI, Mathematical Equations, Scientific Plotting) = (GTK+, LaTeX, Matplotlib)

Filed under: Blog — krkhan @ 10:16 am

GTK+ needs no introduction. LaTeX is the first thing that pops in anyone’s mind if mathematical equations’ typesetting is under consideration. Matplotlib — while not as well-known as the former two — is the super easy and elegant solution for scientific plotting on *nix platforms.

For an application demo, I required all three. Past experience has taught me that the most straightforward way of “gluing” things together is Python. GTK+ therefore = PyGTK. Next up was LaTeX, and a previous solution of mine for embedding LaTeX in PyGTK came to the rescue. The final requirement of Matplotlib was fulfilled without any hassle since the library was already written in Python.

The collective result was pretty:

radareq-0.1.tar.gz

Screenshot of GTK+ with LaTeX and Matplotlib
(Click on the image for larger version.)

The linked tarball contains the Python scripts for the application. For everything to run smoothly, LaTeX and Matplotlib packages need to be installed on your system. If you encounter any issues running the code, feel free to flame your distribution for the apparent lack of sanity regarding package management.

Tags: , , , , , , , , , , ,

September 10, 2009

HOWTO: Use LaTeX mathematical expressions in PyGTK

Filed under: Blog — krkhan @ 10:04 pm

I had never really laid my hands on LaTeX until I required it in one of the helper applications for my graduation project. Unfortunately, the requirement wasn’t as simple as producing some documents as I had to embed mathematical expressions on the fly in my PyGTK apps. Googling around for the solution, I found GtkMathView which accomplished something similar to this albeit using MathML. However, my luck ran out on me again as the widget lacked Python bindings. The other solution was to generate transparent PNGs on the fly and include them as GtkImages. This worked rather well, as the final code allowed easy modifications to the generated expressions.

Requirements for the code were:

Final results:

LaTeX in PyGTK

And the simple code behind it:

1
2
3
4
5
6
7
8
9
10
11
12
13
14
15
16
17
18
19
20
21
22
23
24
25
26
27
28
29
30
31
32
33
34
35
36
37
38
39
40
#!/usr/bin/env python
"""An example demonstrating usage of latexmath2png module for embedding math
equations in PyGTK
 
Author: Kamran Riaz Khan <krkhan@inspirated.com>
"""
 
import gtk
import os
import latexmath2png
 
pre = 'gtktex_'
eqs = [
	r'$\alpha_i > \beta_i$',
	r'$\sum_{i=0}^\infty x_i$',
	r'$\left(\frac{5 - \frac{1}{x}}{4}\right)$',
	r'$s(t) = \mathcal{A}\sin(2 \omega t)$',
	r'$\sum_{n=1}^\infty\frac{-e^{i\pi}}{2^n}$'
	]
latexmath2png.math2png(eqs, os.getcwd(), prefix = pre)
 
def window_destroy(widget):
	for i in range(0, len(eqs)):
		os.unlink(os.path.join(os.getcwd(), '%s%d.png' % (pre, i + 1)))
	gtk.main_quit()
 
window = gtk.Window()
window.set_border_width(10)
window.set_title('LaTeX Equations in GTK')
window.connect('destroy', window_destroy)
vbox = gtk.VBox(spacing = 10)
window.add(vbox)
 
images = [None] * len(eqs)
for i in range(len(eqs)):
	images[i] = gtk.image_new_from_file('%s%d.png' % (pre, i + 1))
	vbox.pack_start(images[i])
 
window.show_all()
gtk.main()
Tags: , , , , , , , , , ,