Facebook Friends Graph — Plotting your social network together
Update: New version
While visiting profile of a friend, I noticed that he and I had about 70 mutual friends. Immediately it gave me the idea to plot the common friend connections and see what interesting patterns emerge in the larger picture. Something like this:
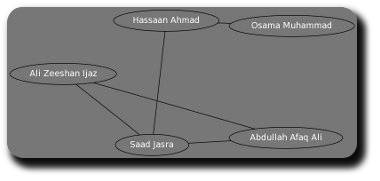
In the sample above, the names in circles (“nodes”) happen to be in my friend list. The connecting lines represent their own friendship status. For example, Saad Jasra and Hassan Ahmad are friends among themselves apart from being my friends on their own. Similarly, Ali Zeeshan Ijaz is a friend of both Saad Jasra and Abdullah Afaq Ali.
Luckily, Facebook API had Python bindings available which considerably simplified my task. Those, coupled with pydot, resulted in a dot file with all the required connections. Graphviz did the remaining work:

(Click on the thumbnail for larger version.)
(Warning: The larger version is a 7329x5953 PNG image with a humongous file size of 13 MB. If your hardware specs are squeamish, don’t blame me if it brings your machine on its knees — this is not a DoS attack.)
Now came the intriguing part. The resulting graph was visibly split in two large portions. This resulted from the fact that I had spent a major portion of my life (15 years to be exact) in Saudi Arabia before moving to Pakistan. More interestingly, an old friend of mine from Saudi Arabia — Atif Sheikh — was also enrolled at my university in Pakistan. When I zoomed into the graph, I spotted him at the nexus of two networks. Similarly, the names in the middle of a network were the most connected people in that network. That is, the names congested in the middle of Pakistan network were friends from university and the names at the edges of that network were friends outside the university who didn’t share my academic connections.
I haven’t polished the code for a stable release yet as I doubt that other people would be interested in having gigantic plots of their social lives. Nevertheless, I’ll try to package it in form of a proper Facebook application in near future. After all, as I quoted in a previous post of mine:
Tags: Facebook, Facebook Friends Graph, Friends, Graph, Graphics, Internet, Open Source, PyFacebook, Python, Social Networking, Statistics, Technology, Web 2.0“Statistics are like a bikini. What they reveal is suggestive, but what they conceal is vital.”