Inspirated


February 26, 2010

Facebook Friends Graph v0.2 — Deb and RPM packages for Ubuntu and Fedora

Filed under: Blog — krkhan @ 2:36 am

Thanks to Christoph Korn, Ubuntu users can now install the package with a single click from the GetDeb repository. The Deb file itself is available on the release page here, along with an RPM for Fedora users.

The looks:

Facebook Friends Graph v0.2 Screenshot

And the hooks:

Changelog:

  • Fixed:
    • Bug #522735: Facebook: Application Request Limit Reached
    • Bug #523378: Connection reset by peer
    • Bug #522487: Facebook Friends Graph fails when friends have a dash in their name [patch by Little Jawa]
Tags: , , , , , , , , , , , , , , ,

February 19, 2010

Facebook Friends Graph on Ubuntu

Filed under: Blog — krkhan @ 12:04 am

I never really thought anyone other than me would be interested in seeing gargantuan graphs of their friends’ connections until I found out through this post on the OMG! Ubuntu! blog that my application was included in the GetDeb repository for Ubuntu users. I have not used Ubuntu myself since about never, but apparently you can now install the application on Karmic Koala with just a few clicks.

Edit: I have now tested the installation on Karmic myself and can guarantee that it indeed works without any fuss. Gotta love Launchpad/Ubuntu.

The application itself was in a pretty much skeletal state of being so I was a little taken aback by the exposure. Nevertheless, I was reminded of the famous aphorism apropos of open source development:

“Release early, release often.” — Linus Torvalds

And indeed, the bug reports that came from users were a valuable byproduct of the Ubuntu push as I had stopped development on the script after it started working fine for me.

Tags: , , , , , , , , , , , , , , ,

February 6, 2010

Inbox Stats v1.1 — S60 3rd Edition Compatibility

Filed under: Blog — krkhan @ 3:16 pm

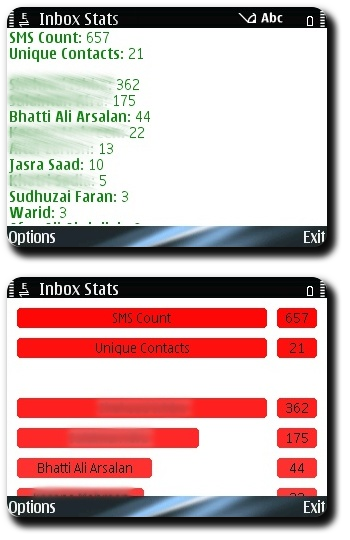
Continuing the migration to E71, here’s the new release for Inbox Stats which works on Python 2.5 releases:

inboxstats-1.1.zip
Inbox Stats v1.1 Screenshot

Tags: , , , , , , , , , , , ,

January 6, 2010

(GUI, Mathematical Equations, Scientific Plotting) = (GTK+, LaTeX, Matplotlib)

Filed under: Blog — krkhan @ 10:16 am

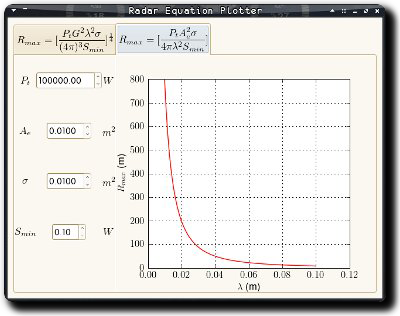
GTK+ needs no introduction. LaTeX is the first thing that pops in anyone’s mind if mathematical equations’ typesetting is under consideration. Matplotlib — while not as well-known as the former two — is the super easy and elegant solution for scientific plotting on *nix platforms.

For an application demo, I required all three. Past experience has taught me that the most straightforward way of “gluing” things together is Python. GTK+ therefore = PyGTK. Next up was LaTeX, and a previous solution of mine for embedding LaTeX in PyGTK came to the rescue. The final requirement of Matplotlib was fulfilled without any hassle since the library was already written in Python.

The collective result was pretty:

radareq-0.1.tar.gz

Screenshot of GTK+ with LaTeX and Matplotlib
(Click on the image for larger version.)

The linked tarball contains the Python scripts for the application. For everything to run smoothly, LaTeX and Matplotlib packages need to be installed on your system. If you encounter any issues running the code, feel free to flame your distribution for the apparent lack of sanity regarding package management.

Tags: , , , , , , , , , , ,

November 21, 2009

Facebook Friends Graph v0.1

Filed under: Blog — krkhan @ 12:01 am

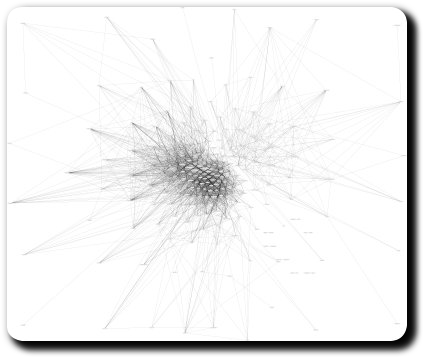
The motivation behind obsession with these manically large graphs is explained in this previous post of mine. The current post’s purpose is to instead link to the (finally) working code for generating the graphs. I have created a project page at Launchpad for this little application. The trunk contains the most recent code, which is still in its nascent form but works pretty well given an installation of PyGTK, Python GtkMozembed and pydot. I might port the application to Windoze in future provided I get the time for it.

Starting with the tradition of linking to Inspirated Code subsection, latest updates about the application shall be posted on this page.

And as is the custom, the image itself:

Facebook Friends Graph
(Click on the thumbnail for larger version.)
(Warning: The larger version is a gigantic 32 MB PNG image with a resolution of 16517x13808 (even larger than the last time). If you want to view it, I recommend downloading it to your hard-disk first and then opening it outside your web browser.)

Tags: , , , , , , , , , , , , ,

September 26, 2009

Facebook Friends Graph — Plotting your social network together

Filed under: Blog — krkhan @ 3:58 pm

Update: New version

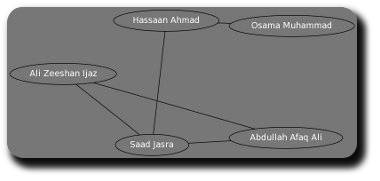
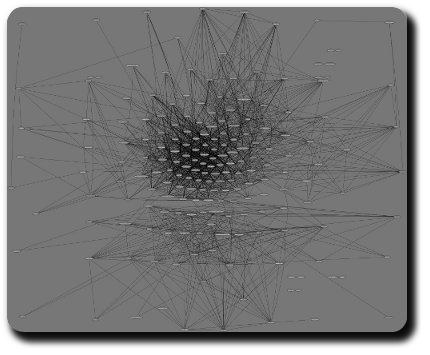
While visiting profile of a friend, I noticed that he and I had about 70 mutual friends. Immediately it gave me the idea to plot the common friend connections and see what interesting patterns emerge in the larger picture. Something like this:

Facebook Friends' Graph Sample

In the sample above, the names in circles (“nodes”) happen to be in my friend list. The connecting lines represent their own friendship status. For example, Saad Jasra and Hassan Ahmad are friends among themselves apart from being my friends on their own. Similarly, Ali Zeeshan Ijaz is a friend of both Saad Jasra and Abdullah Afaq Ali.

Luckily, Facebook API had Python bindings available which considerably simplified my task. Those, coupled with pydot, resulted in a dot file with all the required connections. Graphviz did the remaining work:

Facebook Friends' Graph
(Click on the thumbnail for larger version.)
(Warning: The larger version is a 7329x5953 PNG image with a humongous file size of 13 MB. If your hardware specs are squeamish, don’t blame me if it brings your machine on its knees — this is not a DoS attack.)

Now came the intriguing part. The resulting graph was visibly split in two large portions. This resulted from the fact that I had spent a major portion of my life (15 years to be exact) in Saudi Arabia before moving to Pakistan. More interestingly, an old friend of mine from Saudi Arabia — Atif Sheikh — was also enrolled at my university in Pakistan. When I zoomed into the graph, I spotted him at the nexus of two networks. Similarly, the names in the middle of a network were the most connected people in that network. That is, the names congested in the middle of Pakistan network were friends from university and the names at the edges of that network were friends outside the university who didn’t share my academic connections.

I haven’t polished the code for a stable release yet as I doubt that other people would be interested in having gigantic plots of their social lives. Nevertheless, I’ll try to package it in form of a proper Facebook application in near future. After all, as I quoted in a previous post of mine:

“Statistics are like a bikini. What they reveal is suggestive, but what they conceal is vital.”

Tags: , , , , , , , , , , , ,

September 10, 2009

HOWTO: Use LaTeX mathematical expressions in PyGTK

Filed under: Blog — krkhan @ 10:04 pm

I had never really laid my hands on LaTeX until I required it in one of the helper applications for my graduation project. Unfortunately, the requirement wasn’t as simple as producing some documents as I had to embed mathematical expressions on the fly in my PyGTK apps. Googling around for the solution, I found GtkMathView which accomplished something similar to this albeit using MathML. However, my luck ran out on me again as the widget lacked Python bindings. The other solution was to generate transparent PNGs on the fly and include them as GtkImages. This worked rather well, as the final code allowed easy modifications to the generated expressions.

Requirements for the code were:

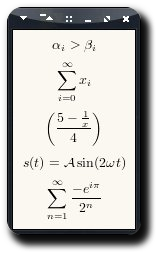
Final results:

LaTeX in PyGTK

And the simple code behind it:

1
2
3
4
5
6
7
8
9
10
11
12
13
14
15
16
17
18
19
20
21
22
23
24
25
26
27
28
29
30
31
32
33
34
35
36
37
38
39
40
#!/usr/bin/env python
"""An example demonstrating usage of latexmath2png module for embedding math
equations in PyGTK
 
Author: Kamran Riaz Khan <krkhan@inspirated.com>
"""
 
import gtk
import os
import latexmath2png
 
pre = 'gtktex_'
eqs = [
	r'$\alpha_i > \beta_i$',
	r'$\sum_{i=0}^\infty x_i$',
	r'$\left(\frac{5 - \frac{1}{x}}{4}\right)$',
	r'$s(t) = \mathcal{A}\sin(2 \omega t)$',
	r'$\sum_{n=1}^\infty\frac{-e^{i\pi}}{2^n}$'
	]
latexmath2png.math2png(eqs, os.getcwd(), prefix = pre)
 
def window_destroy(widget):
	for i in range(0, len(eqs)):
		os.unlink(os.path.join(os.getcwd(), '%s%d.png' % (pre, i + 1)))
	gtk.main_quit()
 
window = gtk.Window()
window.set_border_width(10)
window.set_title('LaTeX Equations in GTK')
window.connect('destroy', window_destroy)
vbox = gtk.VBox(spacing = 10)
window.add(vbox)
 
images = [None] * len(eqs)
for i in range(len(eqs)):
	images[i] = gtk.image_new_from_file('%s%d.png' % (pre, i + 1))
	vbox.pack_start(images[i])
 
window.show_all()
gtk.main()
Tags: , , , , , , , , , ,

August 30, 2009

HOWTO: Add grid lines to a GtkDrawingArea in PyGTK

Filed under: Blog — krkhan @ 6:29 pm

Recently, I needed to create some visualizations in a drawing area for one of my PyGTK apps. The PyGTK tutorial had an excellent writeup complete with a working example for immediate help. Unfortunately, my requirements were of a “grid” view on which other objects would be drawn. Naturally, I hoped for some variable on the GtkDrawingArea which I would set to true and have the grid lines drawn automatically. But since I couldn’t find any such magic setting in the API, I had to draw the lines manually.

Consequently, I could use either of the following approaches:

  • Loop horizontally and vertically while draw_line()ing.
  • Draw a 10×10 box as a tile and repeat it over the background.

The first approach would’ve worked faster but involved writing more code. The second was uglier — especially for larger images — but resulted in me having to add only a few lines to the example:

72
73
74
75
76
77
78
79
80
81
82
83
84
85
86
87
88
89
90
91
        xpm_data = ["10 10 2 1",
            " 	c #EEEEEE",
            ".	c #FFFFFF",
            "          ",
            " ........ ",
            " ........ ",
            " ........ ",
            " ........ ",
            " ........ ",
            " ........ ",
            " ........ ",
            " ........ ",
            "          "]
        tile_pixmap, tile_mask = gtk.gdk.pixmap_create_from_xpm_d(
            area.window, None, xpm_data)
        tile_gc = area.window.new_gc(fill = gtk.gdk.TILED,
            tile = tile_pixmap)
        width = int(self.hruler.get_range()[3])
        height = int(self.vruler.get_range()[3])
        area.window.draw_rectangle(tile_gc, True, 0, 0, width, height)

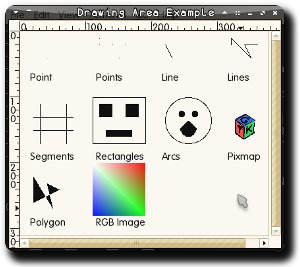
Turning this:

GtkDrawingArea Example

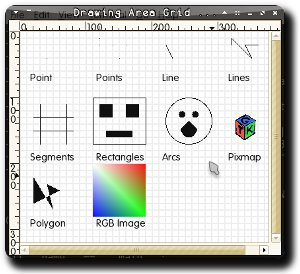
Into this:

GtkDrawingArea Grid Example

Note that the 10×10 tiles’ borders match prettily with the markers on top and left rulers. There will definitely be some more efficient method for achieving this but for the time being tiling serves my needs perfectly.

Tags: , , , , , , ,

August 23, 2009

Workaround for fixing X.org acceleration issues on Intel chipsets

Filed under: Blog — krkhan @ 1:39 pm

Recent X.org drivers for Intel chipsets have introduced a new acceleration method called UXA which is supposed to provide “simpler, faster” code. However, for whatever reason, this bleeding-edge feature actually results in a loss of performance and reliability for particular chipsets (e.g. 915 family) on most distributions (Fedora and Ubuntu to name the foremost). In order to work around these issues, two solutions can be used:

  1. Enable Tiling in xorg.conf.

    Section "Device"
    	Identifier  "Videocard0"
    	Driver      "intel"
    	Option      "Tiling" "False"
    EndSection

    This fix does help the low framerate issue encountered on most distros, but it introduces screen tearing on some installations and worse, can happen in occasional X crashes as well.

  2. Use “greedyMigrationHeuristic with EXA instead:

    Section "Device"
    	Identifier  "Videocard0"
    	Driver      "intel"
    	Option      "AccelMethod" "EXA"
    	Option      "MigrationHeuristic" "greedy"
    	Option      "NoDDC"
    EndSection

    While this completely bypasses the UXA acceleration, it seems to work well for most users.

For the time being, I’m sticking with the second workaround since I have no issues with using the older acceleration architecture until the new one achieves some decent stability.

Tags: , , , , , , , , ,

August 20, 2009

Web 2.5

Filed under: Blog — krkhan @ 11:58 pm

Ladies and gentlemen, let’s bring our hands together for a clamorous round of applause. The greatest browser plugin since the invention of, well… browsers, has been unveiled. Welcome to Quake Live.

An year ago, anyone proposing the idea of running Quake III in a browser would have been sent to the local psych ward. Heck, even a week ago I would’ve been skeptical about practicality of any such development. But sometimes, it just feels wonderful to be proven wrong. This is one of those times and while I shoot railguns aimlessly in the other Firefox tab, I just can’t help staring at the screen in awe. In fact, I can even — for the time being — totally overlook any security concerns related to the plugin. If you own a decent browser, QL’s worth at least a try. I’m not a FPS fan either but this was just too good to be overlooked because of gaming preferences.

Tags: , , , , , , , ,
Next Page »