
Summer of Code Progress: Graphs, logs and acid
| Summer of Code Archive | Inspirated Code |
| Original Proposal | Google Docs |
| Repository | Tor Project Git |
| Mentor Blog | arm Development Log |
The great thing about a command line application is being able to SSH into the thing from anywhere and with anything. Nevertheless, the general public appeal of GUIs has always remained undeniable. After all, over the decades one of the favorite pass times of Steve Jobs — the man who knows a thing or two about public appeal — has been suing and/or getting sued for patents related to GUI. It’s not to say that we are planning an iTorMonitor for App Store (you still have iSSH if you’d like), but a graphical interface shall hopefully go a long way for attracting newbie relay operators.
The first items to be ported to GUI were the bandwidth graphs. After a thorough discussion on #tor-dev regarding how to achieve graphing with respect to feature sets, packaging issues and wheel reinvention; cagraph was chosen as the way to go (among Matplotlib and drawing directly to GDK surfaces). I took screenshots of both interfaces running side-by-side in order to judge how accurate the graphs were and the results look fine:

![]()
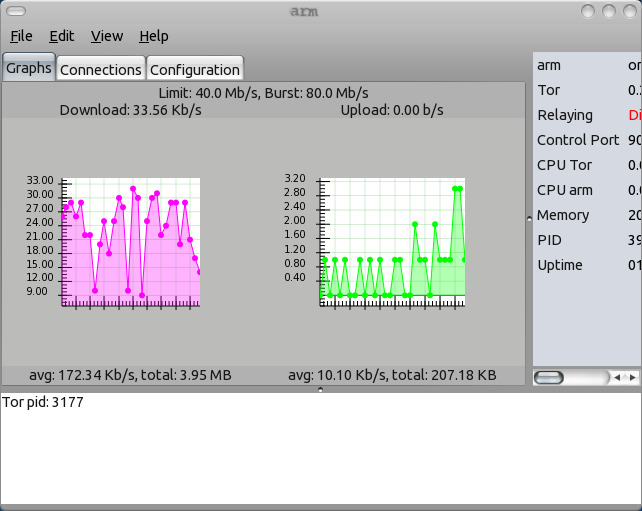
(Click on the thumbnails for larger version.)
Next up were the log messages dispatched by arm or Tor. While Damian would not be entirely happy with the fact that I’m not terribly innovative with the UI translation ;-) , I did stumble upon an interesting side-feature of using timestamp based sorting. The user can sort the entries in ascending order and he’ll always see the recent-most entry as it pops up in the view, or he can revert the order and see old entries at his leisure while the new entries populate elsewhere below.
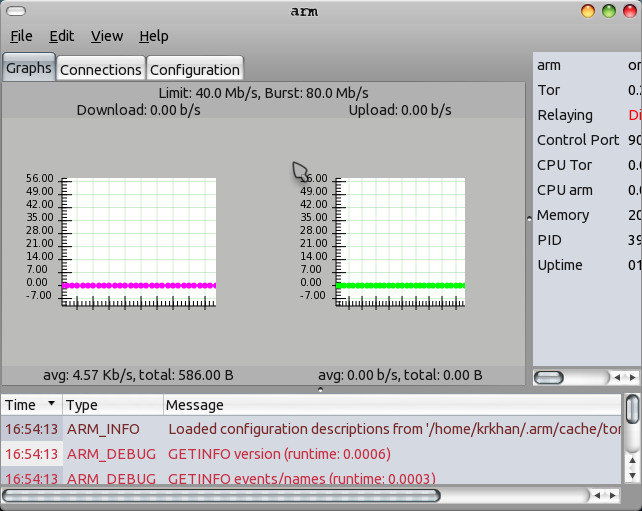
(Click on the thumbnail for larger version.)
One other aspect I noticed while designing the UIs was that I have atrocious color selection skills. The color scheme of the entire application isn’t consistent and might even invite a backlash once it goes public. Therefore I plan on discarding all hardcoded colors in favor of theme colors from GTK+ itself — lest the GUI be packaged into a separate arm-trippy once it makes to major distros.

[…] being the foremost), it fared well in light-weight Unix environment such as Live CDs (e.g., Tails). Bandwidth graphs and logs for various arm events were added to the […]
Pingback by Summing up Google Summer of Code 2011 | Inspirated — October 4, 2011 @ 12:35 pm
[…] Kamran has made some progress with the arm gui, porting the bandwidth graphs and nearly finishing the log panel. This has slipped quite a bit due to illness and family issues, though the parts that are done look great. For a description and screenshot of his work see his blog posting. […]
Pingback by Status Report for June 2011 | Damian's Dev Blog — March 9, 2015 @ 2:24 am